

See how ScaleXP works with Xero or QuickBooks.
In a 30-minute demo, we’ll show the relevant workflows using example data and discuss how they could apply to your finance process. Complex requirements? Discuss them with us first.
Why investors value SaaS companies on ARR, how growth rate and retention change the multiple you're offered, and how to calculate ARR correctly.
The purpose of this article is to explain the link between Annual Recurring Revenue, ARR, and valuation. It provides a quick overview of how to calculate ARR, explains the direct link to valuation and provides some practical tips to increase ARR.
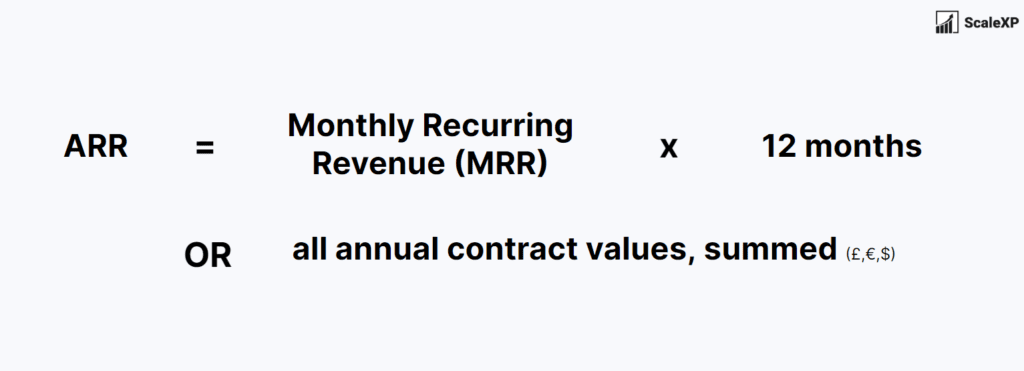
ARR stands for Annual Recurring Revenue. It is the amount of revenue that a SaaS (Software as a Service) company can expect to receive from its customers each year. ARR is calculated by multiplying the monthly recurring revenue (MRR) by 12 or by assessing the annual value of all recurring contracts.
ARR growth rate is the rate at which a SaaS company’s Annual Recurring Revenue is increasing year over year. It is calculated by assessing the change in revenue over a 12-month period. Here is the formula for calculating ARR growth rate below:
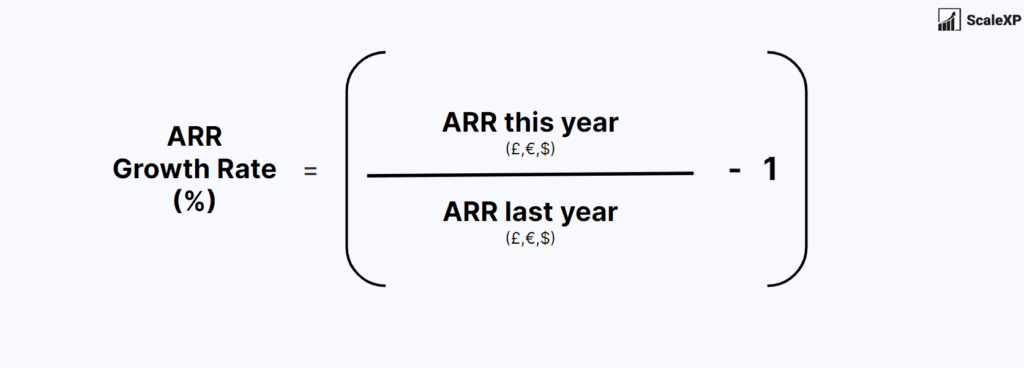
Historically, investors have considered ARR Growth Rate as the single most important metric for determining the value and growth potential of SaaS companies.
Investors value SaaS companies based on their growth potential. Higher growth rates command higher valuations. Lower growth rates lead to lower valuations. This is because they can suggest that the company could be reaching a growth plateau.
As SaaS companies grow, the link between ARR and valuation can change. Early-stage companies may have high growth rates but lower ARR. Valuing such companies may depend on their potential for future growth. As companies mature and establish a more predictable revenue stream, ARR becomes a more important metric for valuation. It provides a clearer picture of the company’s stability and growth potential.
Benchmarking data provides the best view of the relationship between ARR and valuation.See our article on ARR Valuation Benchmarking here.The best benchmarks to consider:
These factors are used to establish a multiple linking ARR and valuation. In Q1 2022, for example, the median publicly traded SaaS company in the SEG SaaS Index was valued at around 9.8x trailing twelve-month revenue. This means that the company valuation was revenue multiplied by 9.8. In Q2 2026, the median EV/TTM revenue multiple across the SEG SaaS Index was 3.2x (SEG, 2Q26 SaaS M&A and Public Market Report).
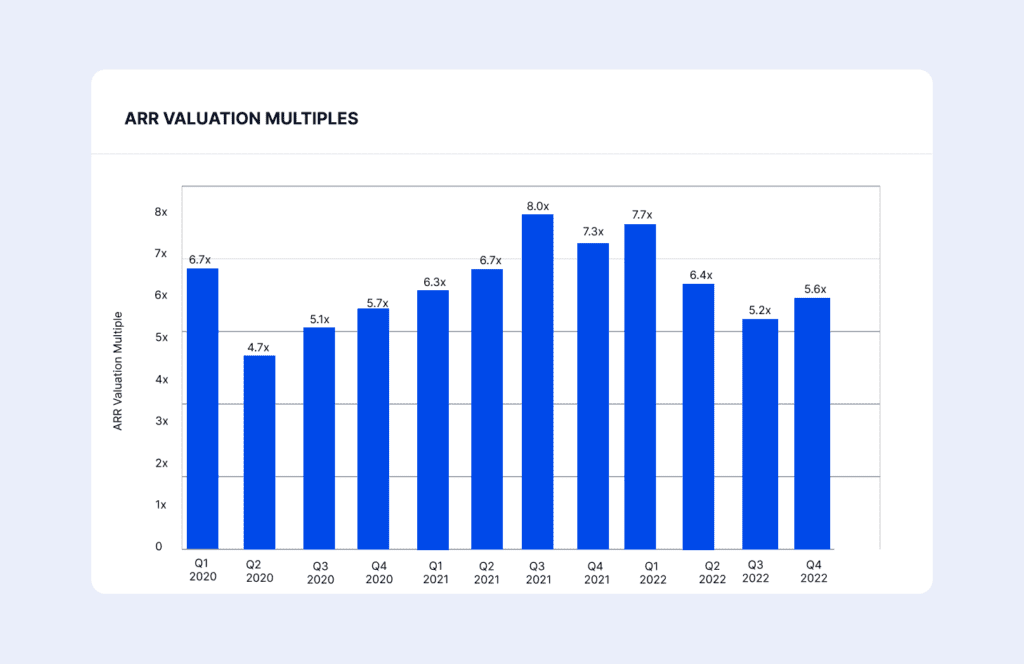
Sources: SEG SaaS valuations, Q1 2022; SEG 2Q26 SaaS M&A and Public Market Report
This graph shows the ARR multiples over the last three years (see current SaaS revenue multiples).
Quick question
Choose as many as apply.
Please don’t include personal information. We read every answer.
Considering automating your SaaS metrics?
See it in a 30-minute demo.
Reporting-time estimator
Your accounting system
How long do your metrics and board reporting take today? Working days per month, roughly
Which of these do you still build by hand? Select all that apply
Which of these takes the most time? Pick one
Your estimate
Board pack ready in about 1 day instead of 2–3 days
ScaleXP calculates the metrics you selected from your live Xero and CRM data, reconciled to the accounts, and places them in a board pack your team reviews rather than builds.
There are several practical steps that SaaS companies can take to increase their ARR. Some of these steps include:
Ultimately, increasing ARR requires creating higher revenue through secure long term contracts.
ScaleXP calculates a full suite of SaaS metrics automatically each month. It imports data from your accounting system (Xero or QuickBooks) and your CRM (HubSpot, Salesforce or Pipedrive). As data is imported, it prepares revenue recognition schedules and a full ARR schedule, broken down by customer.
ARR directly drives SaaS valuation because investors apply a revenue multiple to annual recurring revenue, then adjust that multiple for growth rate and retention. Faster ARR growth and strong net revenue retention earn a higher multiple, while slowing growth or rising churn pulls it down. ScaleXP gives founders and CFOs an accurate, investor-ready view of ARR by calculating it automatically from Xero, QuickBooks Online or Zoho Books invoices and HubSpot, Salesforce or Pipedrive deals. With growth, churn and expansion visible in one ARR waterfall, leadership sees exactly which levers will move the valuation before the next fundraising conversation.
Yes, ScaleXP tracks annual recurring revenue growth rate automatically by rebuilding ARR every month from invoices in Xero, QuickBooks Online or Zoho Books and deal data from HubSpot, Salesforce or Pipedrive. Year-over-year growth, the ARR waterfall of new, expansion, contraction, churn and reactivation, and NRR and GRR all update without spreadsheet work. Estiaan, Finance Manager at Cue Technology, says: “It’s allowed me to provide our directors and potential investors with real-time information on our SaaS metrics.” Finance teams walk into investor meetings with growth figures that are current, consistent and easy to defend.
ScaleXP makes ARR credible in due diligence because every recurring revenue figure reconciles to the financial statements, built from invoices and journals rather than CRM estimates alone. Investors can trace annual recurring revenue from the dashboard down to individual customers and invoices in Xero, QuickBooks Online or Zoho Books. IFRS 15 and ASC 606 revenue schedules sit alongside the SaaS metrics, so recognized revenue and ARR line up. Founders spend less time defending the numbers and more time discussing growth, which strengthens the valuation conversation.
Beyond ARR itself, investors weigh ARR growth rate, net revenue retention, gross revenue retention, churn, CAC payback, LTV and gross margin when setting a valuation multiple. The median public SaaS company in the SEG SaaS Index was valued at around 9.8x trailing revenue in Q1 2022, and those supporting metrics decide where an individual company lands against that benchmark. In Q2 2026 the SEG SaaS Index median EV/TTM revenue multiple was 3.2x. ScaleXP calculates every one of these metrics automatically from Xero, QuickBooks Online or Zoho Books and HubSpot, Salesforce or Pipedrive, with cohort analysis showing whether retention is improving. Finance teams hand investors a complete, consistent metrics pack instead of a patchwork of spreadsheets.
How ScaleXP does this
ScaleXP calculates MRR, ARR, churn, retention and more from your CRM and accounting data, with no spreadsheets. See ScaleXP’s SaaS metrics